
Free Supplier Risk Scorecard Download
Download our free supplier risk scorecard here!
Download the free tool!AI Summarize:
Have you ever heard of forecasting?
Chances are, you have.
Given our current context, it's kind of impossible not to think about the things you can do to prepare your company for the unexpected.
Forecasting is how you literally make that happen.
But…
How can you forecast?
Power BI gives you a middle ground.
It’s affordable, it connects to the data you already have, and it has built-in forecasting features that are surprisingly easy to set up.
Why Power BI for Forecasting?
Easy integration with existing data sources
Even for those of you who get excited at the idea of working with data, making sure everything is correctly organised and updated can be a bit of a problem.
One of the advantages of working with Power BI is that you can quickly upload all of your information, regardless of whether it's stored in a spreadsheet or an ERP.
Built-in forecasting features
Okay, but what if you don't get excited about data analysis?
Then, Power BI is also a good option.
You don’t need to be a data scientist to use Power BI’s forecasting. The platform has time series analysis built right into its visuals.
Visual insights
And speaking about visuals
Isn’t everything better when you don’t have just a messy row of numbers?
And clearer, of course
Power BI turns your data into visuals that actually help you see where your business is headed.
Affordable
Most SMBs can’t justify dropping thousands on enterprise forecasting software.
Power BI is part of Microsoft’s ecosystem, making it far more cost-effective while still powerful enough to grow with you.
Getting Your Data Ready
Okay, yes, forecasting is exciting, but before going all crazy, there’s a factor you can’t skip no matter what. Getting your information ready.
If your numbers are messy, your predictions will be, too.
Importance of clean, consistent data.
And this isn’t just applicable to forecasting.
If you are on your way to analyzing certain aspects of your business, you need to rely on.
Power BI is only as smart as the data you feed it. Inconsistent formats, missing entries, or random errors can throw off your entire forecast.
If your sales data skips months, or your expenses are logged differently every time, Power BI won’t know how to connect the dots, and you’ll end up with trends that don’t actually exist. Clean data ensures that what you see on the chart reflects your factual reality.
Common SMB data sources
Businesses aren't material for one-size-fits-all recipes, but more often than not, you'll probably be using three general types of data.
- Sales history: past orders, revenue trends, and seasonal spikes.
- Inventory records: stock levels, reorder points, and supplier lead times.
- Expenses: recurring costs like rent, payroll, and variable costs tied to sales.
Even if all you have is a simple Excel file of sales by month, that’s enough to start.
Power BI doesn’t require big systems; you can begin small and layer in complexity later.
Tips
- Remove duplicates: Want to make things easier? Be sure you aren't feeding the system with records that have already been uploaded. If a sale got logged twice, your forecast will think demand doubled that day.
- Handle missing values: If you don't have an exact number for certain items or dates, you can calculate an average based on previous amounts.
- Organize by time: Make sure your data has a clear date column (daily, weekly, or monthly). Power BI’s forecasting tools need a proper timeline to work.
Connecting Power BI to Excel/CSV/Google Sheets.
Nothing too complicated at this point
You can import directly from:
Excel or CSV files are the most common starting point.
Google Sheets, connect via a connector or export to CSV.
Databases and cloud apps, if your business has moved beyond spreadsheets.
Free Supplier Risk Scorecard Download
Download our free supplier risk scorecard here!
Download the free tool!.webp)
Step-by-Step: Creating a Forecast in Power BI
1. Load Your Data
Connect Power BI to your data source
Open Transform Data and make sure the date column is a proper date type, remove obvious duplicates, and fill or flag missing values.
Create a simple date table if you can; it helps with time intelligence, and mark it as the model’s date table.
Take a look to see if everything is looking as you need.
2. Build a Line Chart
Add a Line chart visual to the report canvas.
Put your date field on the X-axis and the numeric measure you want to forecast, like sales, units, revenue, etc., on the Y-axis.
Heads up, if you don't want to complicate your life further, better use the plain date field, not the auto-created date hierarchy, and set the X-axis to continuous if Power BI auto-sets it to categorical. This way, the forecast feature only appears on a line chart with a proper time axis and a numeric Y value.
3. Add a Forecast
Open the visual’s analytics pane and find the forecast.
Add a new forecast and configure:
- Forecast length: How far ahead it could be, something like 3 months or perhaps 6 months. You are more than free to match this to your planning horizon.
- Confidence interval: Default is high, like 90% lower if you want a tighter band; however, be aware you’re accepting more risk.
- Seasonality: Power BI can detect it automatically; override it if you know your business cycles, weekly retail spikes, monthly billing, etc.
Apply the settings, and Power BI will draw the forecast line and the shaded confidence band.
4. Interpret the Forecast
Your chart will now include:
- A dotted line showing the forecast values.
- A shaded band represents the confidence interval.
If the shaded band is wide, it means the model has lower certainty.
This often happens when the historical dataset is too short or has irregular gaps. If there's no way you can fix that, see the forecast as a light indicator and not as the rule.
5. Customize for SMB Use Cases
- Sales forecasting: Want to know what's coming next for your sales? Use forecasting. Need to have a clearer picture for a marketing campaign? Forecast as well.
- Inventory demand planning: Forecast product demand and compare against stock levels to set reorder points.
- Budgeting and cash flow: Predict revenue and compare it with recurring expenses.
Common Mistakes to Avoid
Even with Power BI’s built-in forecasting, a few missteps can happen at any point.
Here are the most common issues SMBs run into and how to prevent them:
Using Too Little Data
Forecasts need enough history to detect patterns.
If you only have one or two months of data, the forecast won’t be reliable. Aim for at least a year if possible.
Ignoring Outliers
A sudden sales spike from a one-time event like a bulk order can skew your trend. Clean your data or flag those anomalies so the model doesn’t mistake them for normal patterns.
Skipping Seasonality
If your business has clear cycles, like holiday spikes or slower winter months, make sure seasonality is set correctly.
Leaving it on “auto” works in some cases, but it’s safer to adjust if you know your cycles.
Treating Forecasts as Certainties
The dotted line is a prediction, not a guarantee. Always factor in the shaded confidence range and combine the forecast with your own business knowledge.
Free Supplier Risk Scorecard Download
Download our free supplier risk scorecard here!
Download the free tool!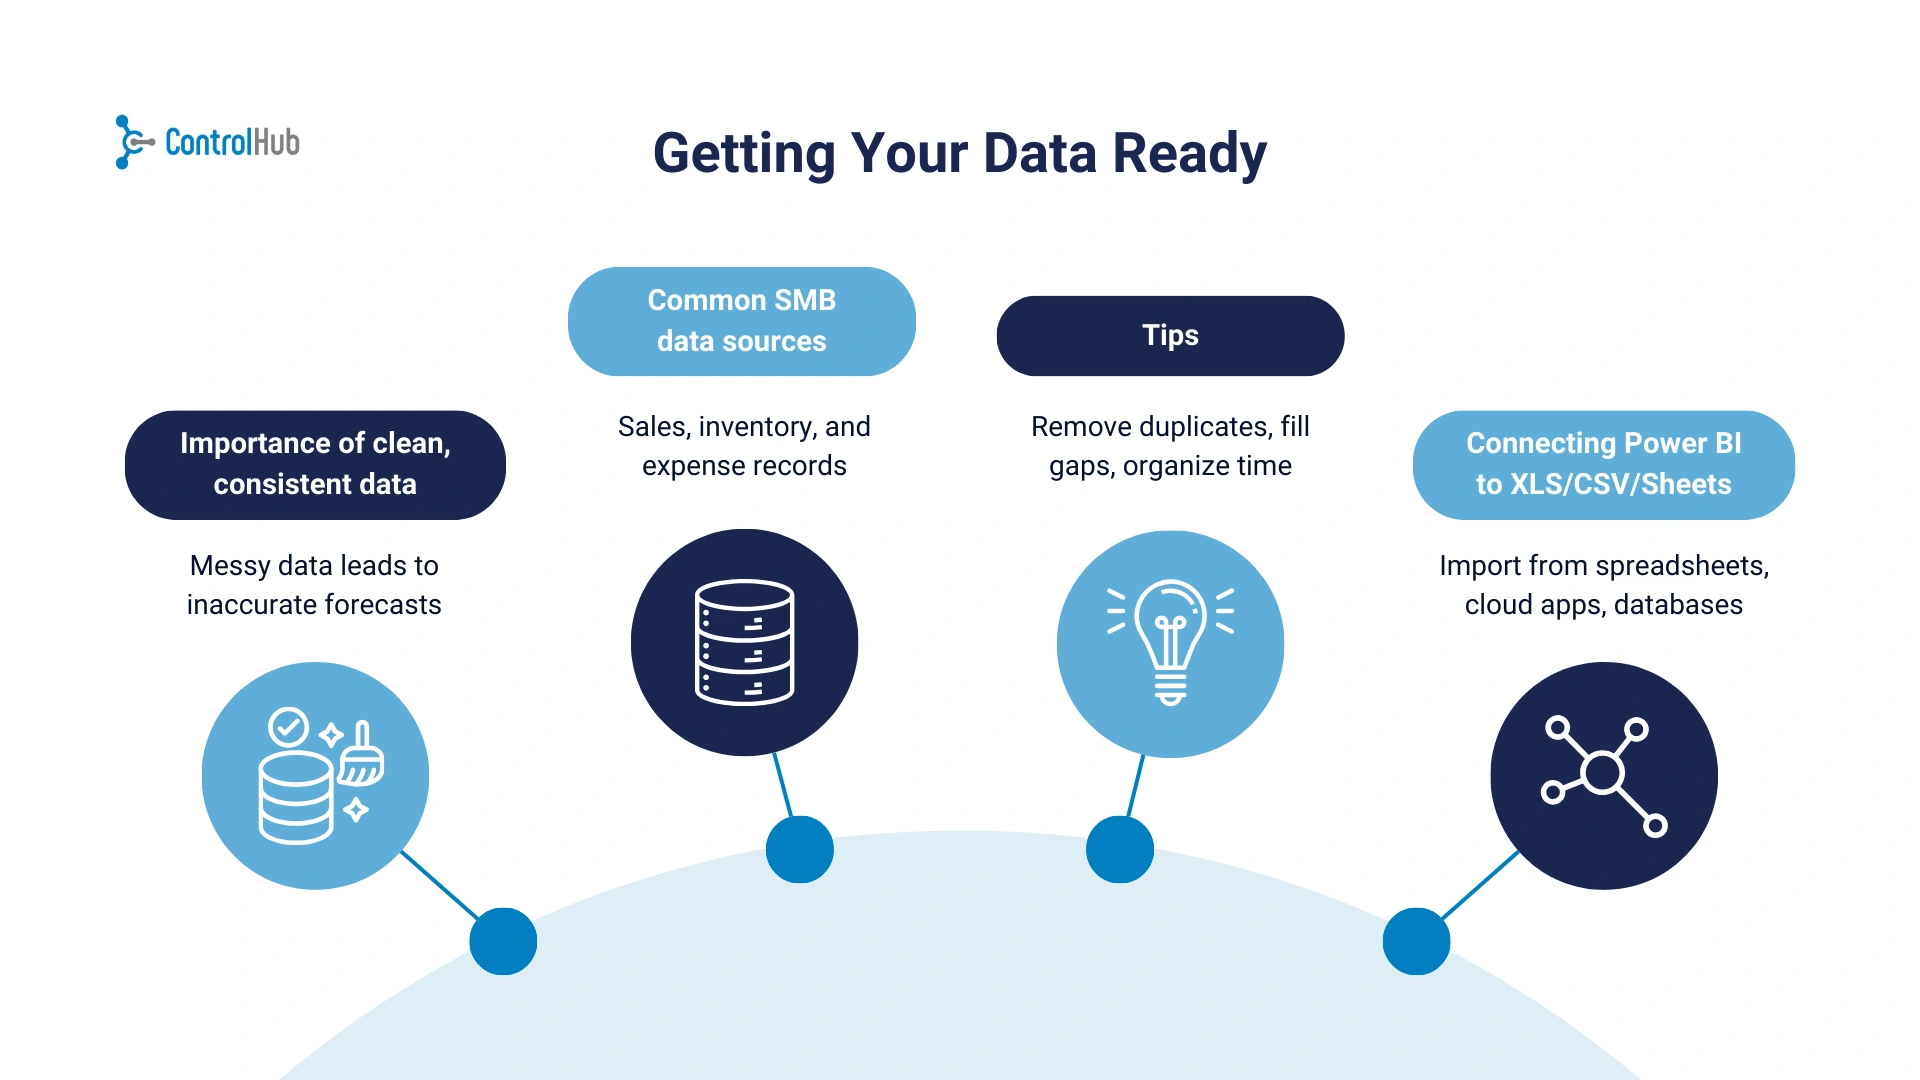
.webp)
Free Supplier Risk Scorecard Download
Download our free supplier risk scorecard here!
Download the free tool!Free Supplier Risk Scorecard Download
Download our free supplier risk scorecard here!
Download the free tool!Key Takeaways
Forecasting doesn’t have to be complicated or expensive. With Power BI, SMBs can take the data they already have, sales, inventory, and expenses, and turn it into forward-looking insights in just a few steps. The process comes down to:
Preparing clean, consistent time-based data.
Building a simple line chart with dates and values.
Using Power BI’s built-in forecasting tool to project trends.
Interpreting the forecast realistically, including the confidence range.
Applying insights directly to sales planning, inventory management, or cash flow
%20(1).avif)


.png)

